| |

 Posted: Posted: Fri Sep 04, 2009 12:19 am
There's too much information contradicting this - what they're calling "the artic hockey stick" study - to put in a single post. All the studies, critiques, and quotes showing this study to be just another desperate attempt at misdirection are gathered up at this link though.
|

 Posts:
 19986
Posted: Fri Sep 04, 2009 1:29 am
Morano’s entire job is to aggregate every misleading factoid, every attack on climate science or scientists, every crank skeptical statement from anyone in the world and send it all out periodically in email blasts that get echoed throughout the right-wing blog world and eventually find their way into places like Fox News and the Weekly Standard. From there they go, via columnists like George Will and Charles Krauthammer, into mainstream outlets like Newsweek and the Washington Post.
|
Posted: Fri Sep 04, 2009 8:12 am
Doesn't matter what you think of Morano, though. The information is in the links. Block your eyes from the editorial, if you want. Just read the links. The conflicting data, and observations from actual scientists is there.
The Kaufman study mentioned in your article is bogus.
|
Posts: 21663
Posted: Fri Sep 04, 2009 11:44 am
The climate depot link Infidel Dog provided is a little strange. They seem to be implying that the study was a creature of teh Washington Post. In fact the study is in the current issue of Science, a well-respected, peer-reviewed journal. Actually, you can read the paper on line for free at http://www.sciencemag.org. I read the critique also at climateaudit, by Steve McIntyre. I don't know, I used to enjoy his stuff more but he's getting decidedly pissy these days, spending most of his time taking a run at the ever-growing number of other researchers he's had run-ins with. I suppose it's a sign of desperation as the scientific weight supporting AGW continues to accumulate, particularly for the Arctic. I didn't find McIntyre's main argument (that the study reversed an axis on a set of lake sediment proxy datat) very convincing. And El Nino's back! Here's an interesting report by NOAA on global temperatures for July 2009. http://www.ncdc.noaa.gov/sotc/?report=global&year=2009&month=7&submitted=Get+ReportSome interesting highlights: The combined global land and ocean surface temperature for July 2009 was the fifth warmest on record The global ocean surface temperature for July 2009 was the warmest on record, El Niño persisted across the equatorial Pacific Ocean during July 2009. the July 2009 Northern Hemisphere sea ice extent was 8.8 million square kilometers (12.7 percent below the 1979–2000 average), resulting in the third lowest July sea ice extent on record, behind 2007 and 2006.
|
ASLplease
CKA Elite

Posts: 4183
Posted: Fri Sep 04, 2009 12:04 pm
imo, anytime a research project produces results that contradict AGW, the researchers get tarred and feathered, and find it increasingly difficult to get funding for further research.
Bureaucrats and Politicians make their living off the backs of the working people. Finding new and ongoing reasons to tax us, and raise our taxes is critical to their survival.
|
Posted: Fri Sep 04, 2009 1:26 pm
Zipperfish Zipperfish: The climate depot link Infidel Dog provided is a little strange. They seem to be implying that the study was a creature of teh Washington Post. I'm always surprised when you post a claim that can so easily be proven false, by just reading the article. Here's a direct quote. "The study will appear in the September 3, 2009 online version of the journal Science."Is it that you don't read the article, or that you don't think I will double-check? Either way, you're wrong. $1: I read the critique also at climateaudit, by Steve McIntyre. I don't know, I used to enjoy his stuff more but he's getting decidedly pissy these days, spending most of his time taking a run at the ever-growing number of other researchers he's had run-ins with. I don't notice any added pissiness in McIntyre's tude, myself, but have you heard what's making him pissy lately? It's this issue of Phil Jones and HadCru refusing to release the raw temperature data. In fact speaking of the online versions of journals like Science and Nature, Nature surprised recently, by actually considering the issue. http://blogs.nature.com/climatefeedback ... ate_1.htmlThe article is almost fair, but to get in on the real fun scroll down for the comments. $1: I suppose it's a sign of desperation as the scientific weight supporting AGW continues to accumulate, particularly for the Arctic. Nonsense. Have you checked out the ice extent graphs lately? The ice is returning, more each year since the 30 year record low of 2007. http://www.ijis.iarc.uaf.edu/seaice/ext ... Extent.png$1: I didn't find McIntyre's main argument (that the study reversed an axis on a set of lake sediment proxy datat) very convincing. Again man, did you actually read his argument, or do you think I won't. Once more, you're wrong. There's more to the argument than that and here's the part that bites. $1: The problem with these sorts of studies is that no class of proxy (tree ring, ice core isotopes) is unambiguously correlated to temperature and, over and over again, authors pick proxies that confirm their bias and discard proxies that do not. This problem is exacerbated by author pre-knowledge of what individual proxies look like, leading to biased selection of certain proxies over and over again into these sorts of studies. There's more to it than that too. Warren Meyer explains the criticism of how proxy data is massaged and altered here. Apparently that's applicable in the Kaufman case. $1: And El Nino's back! Here's an interesting report by NOAA on global temperatures for July 2009. http://www.ncdc.noaa.gov/sotc/?report=global&year=2009&month=7&submitted=Get+ReportEl Nino is a natural process, and has nothing to do with the hypothesis of CO2 forced warming. I can see why you might be hopeful El Nino might cause some warming for you to blame on man-made causes just for the propaganda of it, but as far as the science is concerned the two have nothing to do with each other. I guess you'll say, it's the anomalous extent of the rise CO2 is responsible for. Does that make sense though. CO2 will continue to rise. The temps will go down. Why? Natural variation right. Anyway, I wouldn't get too hopeful if I were you. We're in a negative PDO. Historically, during such periods El Ninos are briefer, and less frequent. All the results aren't in yet, but I'm getting the impression August might take a bit of a dump. Incidentally, did you notice all the evidence popping up lately saying the Arctic was warmer than today in the 30s? It's linked to in the climate depot article. Hey, could you do me a favor though? Watts has a long article critiquing this Kaufman study. Don't read the whole thing, but could you just scroll down to the bottom, and check out those 2 graphs. I think I understand them, but could you give me your opinion on what they appear to show? I'm a little fuzzy on all they imply. If the animated one doesn't animate just right-click -> view image. http://wattsupwiththat.com/2009/09/04/d ... c-warming/
|
Posts: 21663
Posted: Fri Sep 04, 2009 3:24 pm
N_Fiddledog N_Fiddledog: I'm always surprised when you post a claim that can so easily be proven false, by just reading the article. Here's a direct quote.
"The study will appear in the September 3, 2009 online version of the journal Science." Yes, buried in the text later, but the opener is: The Washington Post is touting a new study purporting to show an Arctic temperature "Hockey Stick"?What does the Washington Post have to do with this? News on this study probably appeared in virtually every major daily in Canada and teh US at the very least. N_Fiddledog N_Fiddledog: ]Is it that you don't read the article, or that you don't think I will double-check? Either way, you're wrong. I read the entire article. N_Fiddledog N_Fiddledog: I don't notice any added pissiness in McIntyre's tude, myself, but have you heard what's making him pissy lately? It's this issue of Phil Jones and HadCru refusing to release the raw temperature data. Yes, McIntyre doesn't like the raw temperature data, he doesn't like the interpretation of the raw temperature data (urban heat islands and such), he doesn't like proxy data, and he doesn't like models. He doesn't like much, let's face it. Regarding Jones alleged reluctance to release data, I wonder if McIntyre has ever considered that maybe it's not a conspiracy, but because he's a nuisance, especially given than many scientists are initially cooperative and only become reluctant to release data after having dealt with him a few times. N_Fiddledog N_Fiddledog: Nonsense. Have you checked out the ice extent graphs lately? The ice is returning, more each year since the 30 year record low of 2007. http://www.ijis.iarc.uaf.edu/seaice/ext ... Extent.pngYou are using a local minimum as a baseline instead of a rolling average which would the standard approach in such cases. Using a local minimum is cherry picking. For instance see the attached graph where the sea ice extent in 2009 is compared to 2007 and--here's the key--to the 1979 to 2000 average. http://nsidc.org/data/seaice_index/images/daily_images/N_timeseries.pngN_Fiddledog N_Fiddledog: Again man, did you actually read his argument, or do you think I won't. Once more, you're wrong. Oh yes, I read the complete critique of Kaufman et al 2009 on ClimateAudit regarding the Taljinder proxies. However, apparently Kaufman didn't use any sediment data after 1800 for the Taljinder set (because of data contamination due to anthropogenic influence on sediment from agriculture and bridge building) therefore any influence from that anomaly would be minimized. Also, in many regression techniques some method of least squares is used. When squaring a number, the sign no longer matters (e.g. (-5)^2 = 5^2). N_Fiddledog N_Fiddledog: There's more to the argument than that and here's the part that bites. $1: The problem with these sorts of studies is that no class of proxy (tree ring, ice core isotopes) is unambiguously correlated to temperature and, over and over again, authors pick proxies that confirm their bias and discard proxies that do not. This problem is exacerbated by author pre-knowledge of what individual proxies look like, leading to biased selection of certain proxies over and over again into these sorts of studies. There's more to it than that too. Warren Meyer explains the criticism of how proxy data is massaged and altered here. Apparently that's applicable in the Kaufman case. That's a rather summary dispatch of an entire branch of statistics! But I do agree; no proxy is unambiguously correlated to temperature. But many proxies are ambiguously correlated. That's the whole purpose of these rather complex multivariate statistical analyses--to tease out genuine correlations from several disparate data sets. Certainly McIntyre has done good work in this regard criticizing, for example, Mann's hockey stick. But it's not just Mann. There are a host of other temperature reconstructions, each with their own method, their own preferred datasets and proxies. N_Fiddledog N_Fiddledog: El Nino is a natural process, and has nothing to do with the hypothesis of CO2 forced warming. I can see why you might be hopeful El Nino might cause some warming for you to blame on man-made causes just for the propaganda of it, but as far as the science is concerned the two have nothing to do with each other.
I guess you'll say, it's the anomalous extent of the rise CO2 is responsible for. Does that make sense though. CO2 will continue to rise. The temps will go down. Why? Natural variation right.
Anyway, I wouldn't get too hopeful if I were you. We're in a negative PDO. Historically, during such periods El Niño’s are briefer, and less frequent. All the results aren't in yet, but I'm getting the impression August might take a bit of a dump. The significance here is that La Nina has been predominate the last few years, which one would normally equate with cooler average global temperatures, Despite La Nina, average annual global temperatures have still been warmer than long-term averages. For example, 2008 was the coolest year of the century, but still (if I recall) warmer than any instrumental record prior to 1995. With El Nino back, you're probably going to see the end of the "it's been getting cooler since 1998" argument. N_Fiddledog N_Fiddledog: Incidentally, did you notice all the evidence popping up lately saying the Arctic was warmer than today in the 30s? It's linked to in the climate depot article. Hey, could you do me a favor though? Watts has a long article critiquing this Kaufman study. Don't read the whole thing, but could you just scroll down to the bottom, and check out those 2 graphs. I think I understand them, but could you give me your opinion on what they appear to show? I'm a little fuzzy on all they imply. If the animated one doesn't animate just right-click -> view image. http://wattsupwiththat.com/2009/09/04/d ... c-warming/It’s difficult to say. Over that time period (1990 to present), what is the anomaly? Less than 1 K that’s for sure. Could you even see a difference of 1 K on that graph? I doubt it. Probably if it was an animation of anomalies (deviation from a given average) it would be clearer. I found a paper that anlyzes the DMI datat here. http://www.cru.uea.ac.uk/cru/data/greenland/vintheretal2006.pdfThey conclude that the warmest decades for that data set (Greenland) were the 1930s and 1940s. On the other hand, some stations did show a sharp upswing in the 1990s.
|
Posted: Fri Sep 04, 2009 6:57 pm
$1: You are using a local minimum as a baseline instead of a rolling average which would the standard approach in such cases. Using a local minimum is cherry picking. For instance see the attached graph where the sea ice extent in 2009 is compared to 2007 and--here's the key--to the 1979 to 2000 average. http://nsidc.org/data/seaice_index/imag ... series.pngLocal minimum? Explain. Do you have a link saying that's what AMSRE does? So basically it sounds like you're saying AMSR-E sucks. Only NSIDC knows what they're doing. Very well let's look at them then. 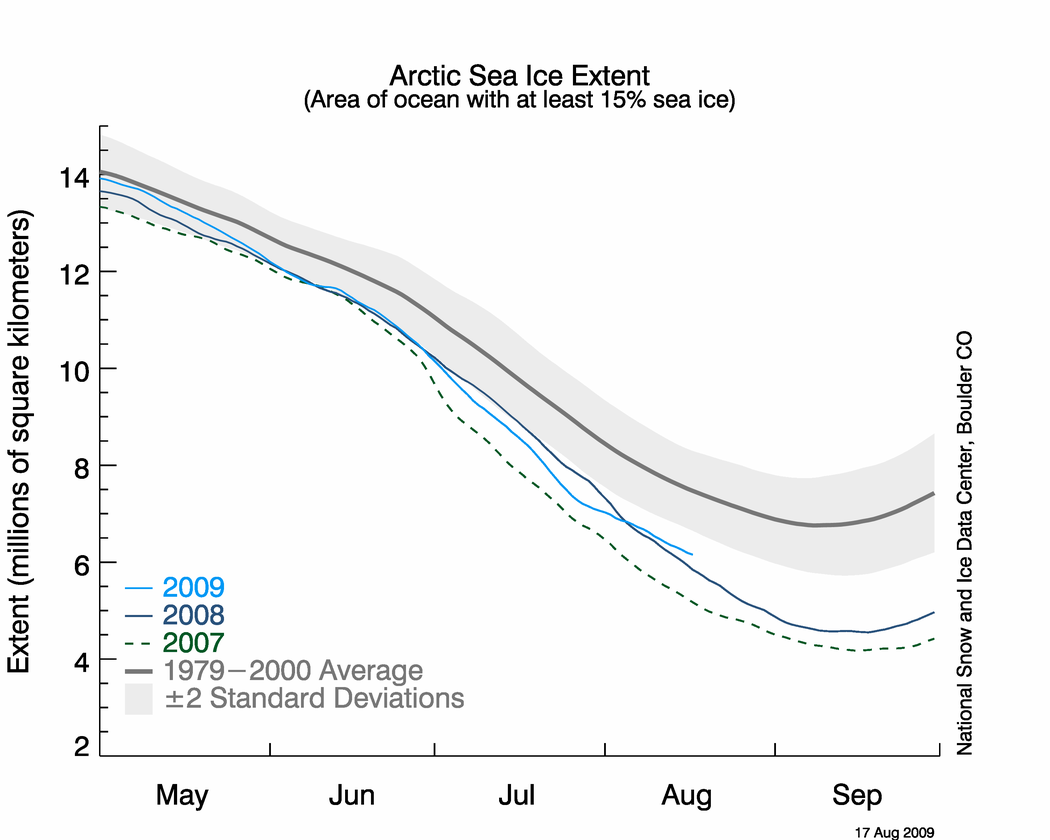 That's a couple of weeks ago, but it shows the same thing as AMSR-E The sea ice minimum peaked in 2007. There was more ice at the September minimum in 2008. There will be more ice still in 2009. The ice is recovering. Is it just AMSR-E you're having a problem with. What about SSMI?  or DMI?  They all show the same thing. Ice Extent is recovering. Can you explain this local minimum thing to me though? Do you mean something like AMSR-E uses a specific location to compute a baseline, or something? I do understand about how NSIDC uses a 1979 to 2000 average to compute the baseline though. Here's something I always wondered about that. Why 1979 to 2000? Why not more current? Say 1988 to 2009? If you did that though wouldn't those gray average bars in NSIDC move down. Doesn't choosing 1979 to 2000 tend to move the average up making the space between look larger? It doesn't really matter to me for these purposes. I just want to know which year is above which, at the September minimun. Moving on though, I wouldn't be making too many predictions based on the July spike, if I were you. With SST for instance Spencer says this... $1: Also note that sea surface temperature tends to peak after months of anomalously low wind conditions, then falls as wind speeds increase. Currently Global temps look like this... 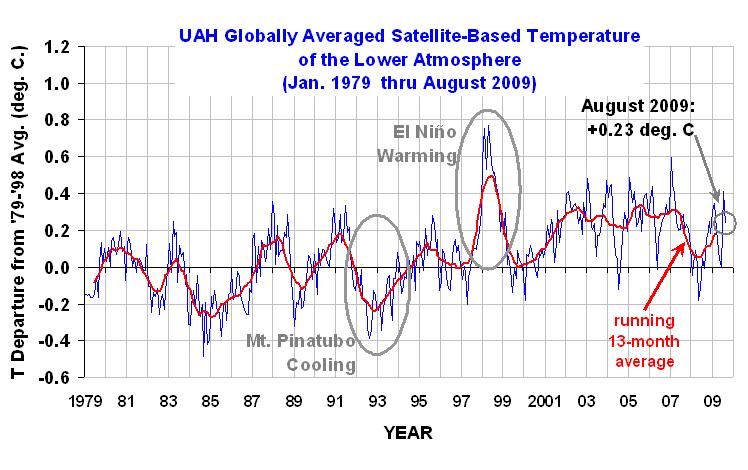 You're a long way from 1998 just yet. Another thing to compute is seeing as we're beginning a 30ish year negative PDO, La Ninas should tend to be more frequent, and last longer than El Ninos.
|
Posts: 21663
Posted: Fri Sep 04, 2009 10:53 pm
N_Fiddledog N_Fiddledog: Local minimum? Explain. Do you have a link saying that's what AMSRE does?
So basically it sounds like you're saying AMSR-E sucks. Only NSIDC knows what they're doing. Very well let's look at them then. No that's not what I'm saying at all. I'm saying that picking the year with the lowest ice extent in recent memory and then using that as your yardstick is cherry picking. The standard approach is to use an average over a period of years, so that you can compare to that. It's the same with the sceptics picking 1998 as their standrad for global wamring. 1998 apparently had a very strong El Nino--which, as you say, is a natural phenomenon. So they pick this year where this El Nino was very strong and using that as proof that there is no global warming (the "no warming since '98" argument). $1: I do understand about how NSIDC uses a 1979 to 2000 average to compute the baseline though. Here's something I always wondered about that. Why 1979 to 2000? Why not more current? Say 1988 to 2009? If you did that though wouldn't those gray average bars in NSIDC move down. Doesn't choosing 1979 to 2000 tend to move the average up making the space between look larger? It doesn't really matter to me for these purposes. I just want to know which year is above which, at the September minimun. I've no idea why they pick the averages they do. I read somewhere once, but I can't remember the reasoning now. AS for picking July, I didn't really pick it as an anomalous record. It's just the most recent month on the NOAA website.
|
Posts: 14139
Posted: Fri Sep 04, 2009 11:35 pm
Actually, this isn't exactly scientific data but, according to the fishing fleet on Deadliest Catch, the northern pack ice in 2008 came farther south than it had in recent years. Quite frankly, I'm gonna believe people that make their living on the Bering Sea over some scientists and GW goobers with an agenda.
|
Posts: 21663
Posted: Sat Sep 05, 2009 7:33 am
PublicAnimalNo9 PublicAnimalNo9: Actually, this isn't exactly scientific data but, according to the fishing fleet on Deadliest Catch, the northern pack ice in 2008 came farther south than it had in recent years. Quite frankly, I'm gonna believe people that make their living on the Bering Sea over some scientists and GW goobers with an agenda. I'll stick with the science myself. Better track record.
|
Posted: Sat Sep 05, 2009 9:05 am
Zipperfish Zipperfish: I'm saying that picking the year with the lowest ice extent in recent memory and then using that as your yardstick is cherry picking. The standard approach is to use an average over a period of years, so that you can compare to that. It's not cherry picking though, because warmists are talking about a rapidly melting arctic as if it's still happening. It's not though. The ice has been recovering for the last 2 years. The drastic period of the melt only lasted about 10 years. 2007 therefore looks like a peak low for ice extent. The arctic oscillation flipped around 2007, as did the PDO. People who notice climate shifts follow ocean oscillations expected the ice recovery after 2007, and that's what happened. People who talk about the arctic melt as if it's current should start to notice stuff like how the glaciers have slowed in Greenland recently, and how they grew last year in Alaska. $1: It's the same with the sceptics picking 1998 as their standrad for global wamring. 1998 apparently had a very strong El Nino--which, as you say, is a natural phenomenon. So they pick this year where this El Nino was very strong and using that as proof that there is no global warming (the "no warming since '98" argument). You may have been able to make that case at one time. Not so much any more. 1998 is no longer necessary as the year to key from. What they say now is no warming since 1997, cooling since 2002, and no statistical warming for the last 15 years. Here's an example from a recent study by Lindzen... $1: The global surface temperature record, which we update and publish
every month, has shown no statistically-significant “global warming”
for almost 15 years. Statistically-significant global cooling has now
persisted for very nearly eight years. Even a strong el Nino – expected
in the coming months – will be unlikely to reverse the cooling trend. Carbon Dioxide Irrelevant in Climate DebateCurrently 1998 is starting to look like a peak year. Yes it was an El Nino year, in fact it's often referred to as a super El Nino, however the 20 year warming spike from 1978 was characterized by more frequent El Ninos. Take them out and what have you got? No warming. That's important I think, because the whole global warming hysteria thing would never have happened without those 20 years. Frequent El Ninos could have been expected during those 20 years, because we were in a positive PDO. In fact that period is sometimes called the Great Pacific Climate Shift, because of the hyper positive PDO. So either El Ninos, which are a natural phenomena matter, or they don't. If they don't, where's your warming? If they do what's wrong with noticing the period of frequent powerful El Ninos peaked in 1998, as was expected, and now we're cooling?
|
Posts: 21663
Posted: Sat Sep 05, 2009 11:13 am
$1: It's not cherry picking though, because warmists are talking about a rapidly melting arctic as if it's still happening. It's not though. The ice has been recovering for the last 2 years. The drastic period of the melt only lasted about 10 years. 2007 therefore looks like a peak low for ice extent. The arctic oscillation flipped around 2007, as did the PDO. People who notice climate shifts follow ocean oscillations expected the ice recovery after 2007, and that's what happened.
People who talk about the arctic melt as if it's current should start to notice stuff like how the glaciers have slowed in Greenland recently, and how they grew last year in Alaska. It's cherry picking. Standard practice is to take a running average over a period of years and compare it to that. Furthermore, it's the theory of climate change, not weather change. Climate chnage will probably only become blatantly obvious by 2050 or 2070--if indeed teh theory is correct. It's a mild but relentless forcing that imposes itself over natural weather patterns. $1: You may have been able to make that case at one time. Not so much any more. 1998 is no longer necessary as the year to key from. What they say now is no warming since 1997, cooling since 2002, and no statistical warming for the last 15 years. Here's an example from a recent study by Lindzen... If you just take the last 15 years, that may be true. If you take the last 150, it's not. $1: Currently 1998 is starting to look like a peak year. Yes it was an El Nino year, in fact it's often referred to as a super El Nino, however the 20 year warming spike from 1978 was characterized by more frequent El Ninos. Take them out and what have you got? No warming. That's important I think, because the whole global warming hysteria thing would never have happened without those 20 years. Frequent El Ninos could have been expected during those 20 years, because we were in a positive PDO. In fact that period is sometimes called the Great Pacific Climate Shift, because of the hyper positive PDO. So either El Ninos, which are a natural phenomena matter, or they don't. If they don't, where's your warming? If they do what's wrong with noticing the period of frequent powerful El Ninos peaked in 1998, as was expected, and now we're cooling? Time will tell. But then it leads to a couple of very iteresting question. If temperatures are indeed falling, then why isn't the concentration of carbon dioxide also falling (according to the sceptcis argument, carbon dioxide concentrations lag temperatures, so cooler temperatures should result in lower CO2 concentrations. We're not seeing that.) Also, CO2 _is_ a greenhouse gas. So it would lead the question of how CO2 concentrations could increase so steeply and so quickly and yet produce no warming effect. You'd need a physical basis to counteract the increased infrared radiation refelcted back to the Earth's surface.
|
 
|
Page 1 of 1
|
[ 15 posts ] |
Who is online |
Users browsing this forum: No registered users and 8 guests |
|
|


") Site Admin
Site Admin 


